Answer:
The mean decreases, while the median stays unchanged.
Step-by-step explanation:
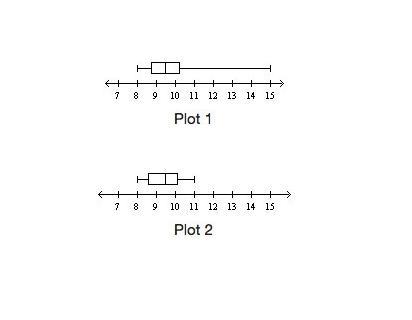
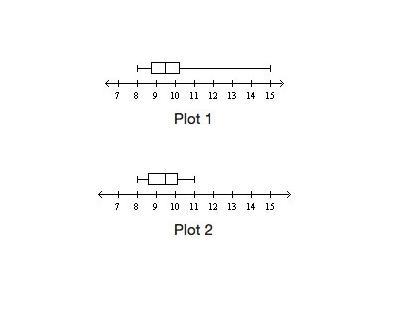
A box plot is constructed from the quartiles of the data distribution, incorporating the maximum and minimum values. From this, one can determine the range, median, and interquartile range.
In this scenario, the median maintains its value at $9.5 per hour. The median is represented by the middle line in the box, which remains constant.
Conversely, the range of this data set shrinks from 7 to 3.
Moreover, the mean must decrease because values greater than $11 are no longer represented in the second box plot. The mean is a measure sensitive to such alterations.
Conclusively, the correct finding is The mean decreases, while the median remains unchanged.