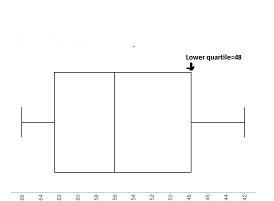
Conclusion: 48
Detailed process:
The data provided: 42 48 43 65 58 47 60 56 52 64 51 66 56 62
Arrange in ascending order: 42, 43, 47, 48, 51, 52, 56, 56, 58, 60, 62, 64, 65, 66
As the lower quartile represents the median of the lower half.
the lower half of the dataset: 42, 43, 47, 48, 51, 52, 56
Median of the lower half = 48
Hence, the lower quartile = 48
The upper quartile denotes the median of the upper half.
Upper half of the dataset: 56, 58, 60, 62, 64, 65, 66
Median of the upper half = 62
Thus, the upper quartile = 62
Given that the number of data points is 14
The median constitutes the average of the two middlemost values.
Median of the dataset: 
Least value = 42
Highest value = 66