Roxanne likes to fish. She estimates that 30% of the fish she catches are trout, 20% are bass, and 10% are perch. She designs a
simulation. Let 0, 1, and 2 represent trout.
Let 3 and 4 represent bass,
Let 5 represent perch.
Let 6, 7, 8, and 9 represent other fish.
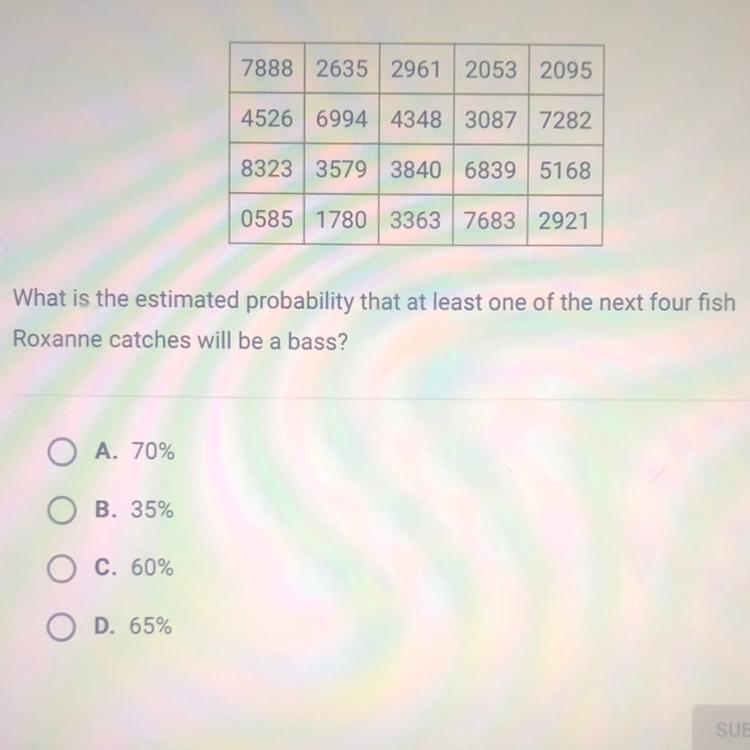
The table shows the results: