Answer:
Refer to the explanation below
Step-by-step explanation:
The graph can represent a relay race scenario.
Jamie describes a situation that corresponds to the piecewise function illustrated in the graph.
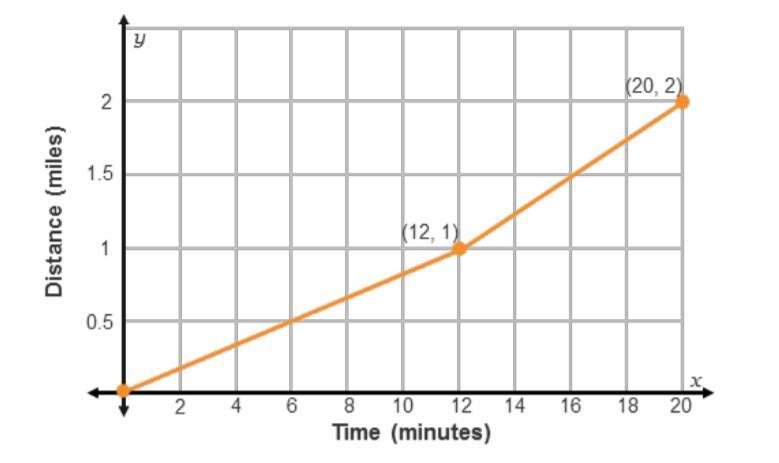
On the graph, the x-axis denotes time in minutes, while the y-axis shows distance in miles.
The initial segment of the graph is a line that extends from the origin to the point (12, 1), with the second segment going from (12, 1) to (20, 2).
1. A runner starts the race and maintains a consistent speed for 1 minute.
- This statement is erroneous as it identifies the incorrect axis.
It should state: a runner initiates the race and runs consistently for 12 minutes, covering 1 mile.
The equation for this segment:
- y = mx + b
- b = 0 since it originates from the starting point.
- m = 1/12
- y = 1/12x
- x = [0, 12], y = [0, 1]
2. Then, his partner takes over and runs faster at a steady pace for another 1 minute.
- Once again, as mentioned earlier, this misrepresents the axis.
It should say: his partner then continues and runs at a constant, quicker pace for an additional 8 minutes, finishing the final mile of the race.
The equation for this segment:
- b = 1, serving as the initial point
- m = (2-1)/(20-12) = 1/8
- y = 1/8x + 1
- x = (12, 20], y = (1, 2]