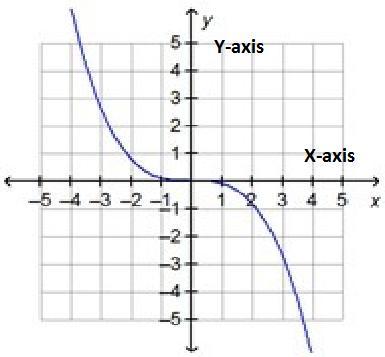
Answer: The last graph is the right choice. Its image is provided.
Detailed explanation:
We have four distinct graphs to analyze and must identify which one qualifies as a function.
In graphing terms, a function is defined as follows:
FUNCTION: A function on a coordinate plane has the property where each 'x' value links to a single 'y' value
This means one 'x' cannot correspond to two separate 'y' values.
Observations show that
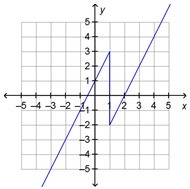
In graph (1), x = 1 corresponds to y = 3 and -2.
In graph (2), x = 2 gives y = 2 and -2.
In graph (3), x = -3 corresponds to y = 2 and -2.
Thus, these three graphs do not represent functions. But, in graph (4), each 'x' uniquely pairs with only one 'y'.
For instance, if x = 1, then y = 0
if x = 0, then y = 0, and so forth.
Consequently, graph (4) demonstrates a function. Its image is attached.