answer.
Ask question
Login Signup
Ask question
All categories
  • English
  • Mathematics
  • Social Studies
  • Business
  • History
  • Health
  • Geography
  • Biology
  • Physics
  • Chemistry
  • Computers and Technology
  • Arts
  • World Languages
  • Spanish
  • French
  • German
  • Advanced Placement (AP)
  • SAT
  • Medicine
  • Law
  • Engineering
zaharov
2 months ago
9

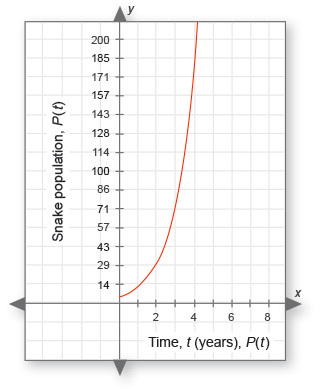
Below is the graph of the boa constrictor population. The x-axis is t, the time in years, and the y-axis is P(t), the snake popu

lation for any given year. In this case, t = 0 indicates the year they started keeping track of the boa population. Scientists want to know how the snake population is changing every two years so they can make predictions about the next two years.
Students' Conjectures:

Two students, Sarah and Ernest, agree that the graph is exponential but disagree on how the rate changes between successive time periods.

1. Complete the table below to summarize each classmate's conjecture. (2 points: 1 point for each row of the chart)
Classmate Conjecture
Ernest


Sarah


2. Using your knowledge of exponential functions, who do you think is correct? (1 point)


Analyzing the Data:

3. Is this graph increasing or decreasing? Does this imply that the boa constrictor population is growing or diminishing? (1 point)


4. Looking at this graph, would you agree that the boa constrictor population could be a problem? (1 point)


5. What is the horizontal asymptote of this graph? (1 point)


6. What is the range? Explain. (1 point)


7. What is the y-intercept? What does this mean in terms of the snake population? (1 point)


Here is the function for this graph, where t is the time in years: P(t) = 5e0.89t.

8. Use this formula to estimate the boa constrictor population in 2 years, 4 years, and 6 years. (6 points: 2 points for each year, including 1 point for showing your work and 1 point for the answer)
t: Time in years P(t): Estimated snake population at time t
2


4


6


9. Find the rate of change for the snake population from year 0 to year 2. (2 points)


10. Apply the rate of change you found in question 9 in order to estimate the snake population for year 4. How does your answer compare with the calculated value? (1 point)


11. If there are approximately 36,660 snakes (rounded to the nearest 10) in year 10, how many will there be in year 12? (1 point)


Making a Decision:

12. Given your calculations above, is Ernest's or Sarah's conjecture correct? (2 points)
Mathematics
1 answer:
zzz [12.3K]2 months ago
5 0
I will address question number 3 since questions 1 and 2 are missing. 3. The graph is on an upward trend, indicating that P(t) values rise as time progresses. This leads us to conclude that the boa constrictor population is indeed increasing. 4. Based on the graph, it's reasonable to say that the growing boa constrictor population might pose significant issues, particularly since it grew from P(t)=7 at t=0 to P(t)=176 at t=4 years. 5. The graph's horizontal asymptote stands at P(t)=7. 6. Given that P(t)=7 at t=0 and the population continues to rise, the range of the graph is represented as [7,∞). 7. The y-intercept occurs at t=0, thus P(t)=7 at that point, which translates to a y-intercept of (0,7). 8. According to the provided formula, the estimated boa population intervals will be as follows: i. At t=2 years, using the formula P(t)=5e^(0.89t), and substituting t=2, we find P(2)=5e^(1.78)≈30. ii. For t=4 years, substituting t=4 gives P(4)=5e^(3.56)≈176. iii. At t=6 years, substituting t=6 yields P(6)=5e^(5.34)≈1043. The rate of population change from t=0 to t=2 is found using the formula [P(2)-P(0)]/(2-0). Here, P(0)=5e^(0)=5, and P(2)≈30, so (30-5)/2=12.5 results in a rate of change of 12.5. 10. Applying this rate, at t=4 years, we'd estimate P=12.5*4=50, which is lower than the calculated result because our assumption models linear growth rather than the actual exponential increase. 11. Assuming there is about 36,660 snakes in year 10, for year 12 we use P(12)=5e^(10.68), yielding approximately P(12)=217,388, rounded to the nearest 10.
You might be interested in
On a coordinate plane, parallelogram H I J K is shown. Point H is at (negative 2, 2), point I is at (4, 3), point J is at (4, ne
tester [12383]
The characterization of HIJK as a parallelogram arises from the fact that the midpoints of both diagonals coincide at (1, 0), which indicates that these diagonals bisect each other. To explicitly demonstrate this, we determine that the midpoints of the diagonals HJ and IK are equal, confirming HIJK's properties as a parallelogram.
6 0
1 month ago
Read 2 more answers
A new weight-watching company, Weight Reducers International, advertises that those who join will lose an average of 10 pounds a
Inessa [12570]

Answer:

The value calculated is Z = 2.53, which exceeds 1.96 at a significance level of 0.05

This leads to the rejection of the null hypothesis H₀

Thus, we accept the alternative hypothesis

This implies that individuals participating in Weight Reducers will lose more than 10 pounds

Step-by-step explanation:

Step(i):-

The size of the random sample 'n' = 50

The new weight-loss program, Weight Reducers International, claims that members will shed an average of 10 pounds within the initial two weeks, with a standard deviation of 2.8 pounds.

Population mean 'μ' = 10 pounds

Population standard deviation 'σ' = 2.8 pounds

Sample mean 'x⁻' = 9

Significance level ∝ = 0.05

Step(ii):-

Null hypothesis: H₀: μ < 10

Alternative hypothesis: H₁: μ > 10

Test statistic calculation

z= \frac{x^{-} - mean}{\frac{S.D}{\sqrt{n} } }

z= \frac{9 - 10}{\frac{2.8}{\sqrt{50} } } = \frac{-1}{0.395} = 2.53

The determined Z value is 2.53

In this case, the critical value Z is 1.96 at the 0.05 significance level

Step(iii):-

Calculated Z value of 2.53 is greater than 1.96 at a significance level of 0.05

Consequently, we reject the null hypothesis H₀

We accept the alternative hypothesis

Conclusion:-

We determine that individuals who sign up for Weight Reducers will experience a weight loss exceeding 10 pounds

6 0
2 months ago
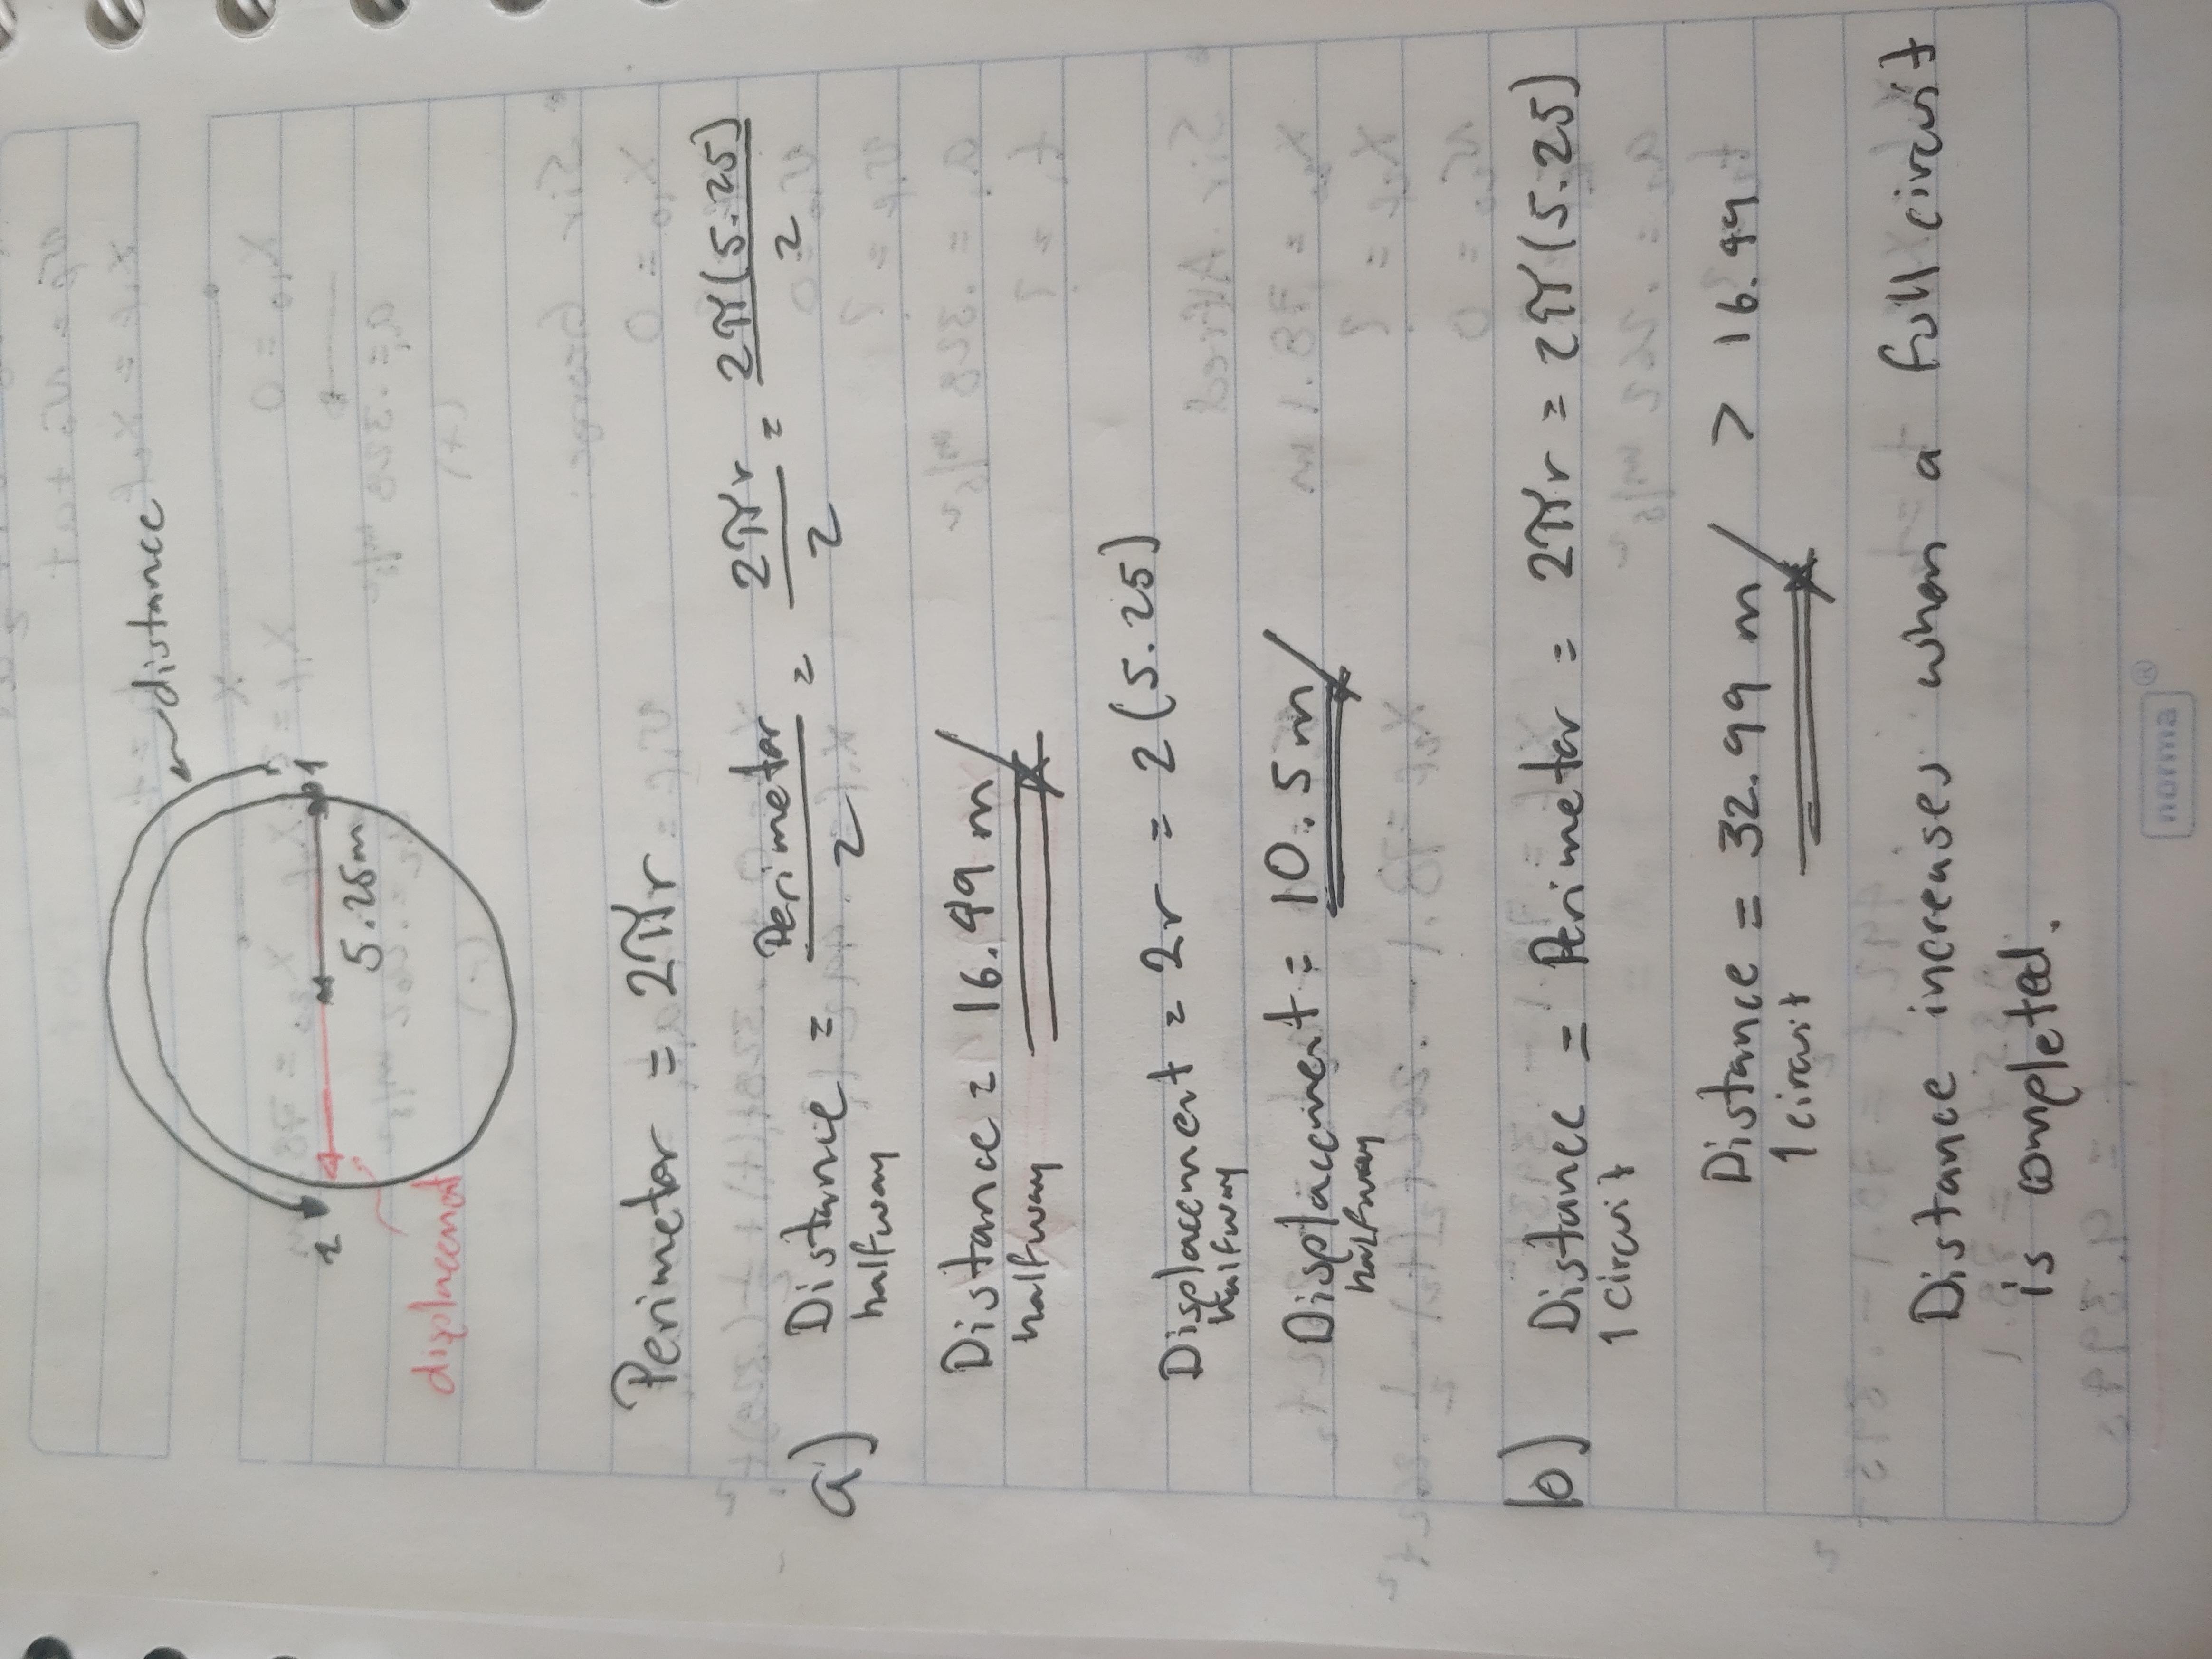
A child rides a pony on a circular track whose radius is 5.25 m. a) Find the distance traveled and the displacement after the ch
tester [12383]

Answer:

a) The distance covered halfway = 16.49 [m], while the displacement at that point = 10.5 [m]b)

The distance traveled increases

when the child finishes one lap around the track.

Step-by-step explanation:

a)

Distance is a scalar measurement

that indicates how much ground an object has traversed in motion. Contrarily, displacement is a vector measurement which describes how far an object is from its original position after moving.

In this scenario, the child travels halfway around the circular track from point 1 to point 2. We know that the circumference or perimeter of a circle can be calculated as 2*PI*radius. Since the child only covers half the distance, we need to divide the circumference by 2, leading to distance = PI*radius

The halfway distance = (PI)*(5.25) = 16.49 [m]
Considering the definition of displacement, it’s clear that the distance from point 1 to point 2 equals one diameter from the starting point:

The halfway displacement = D = 2*radius = 2(5.25) = 10.5 [m]

b) What occurs to the distance after the child completes one full circuit? The distance will increase since the child covers more ground during the full lap:

  • The distance for one circuit = 2*(PI)*radius = 2(PI)(5.25) = 32.99 [m]

32.99 is greater than 16.49, confirming that the distance does indeed increase.

3 0
2 months ago
Find the height of mt.Whitney in the table, Round the height to the nearest thousands feet.
zzz [12365]
<span>15000 feet The height of Mt. Whitney is listed as 14,505 feet. To round this figure to the closest thousand, we examine the hundreds digit, which is 5. According to the rounding rule, "5 or above, round up, 4 or below, round down". Given that the digit is 5, we round up to yield 15000 feet</span>
8 0
1 month ago
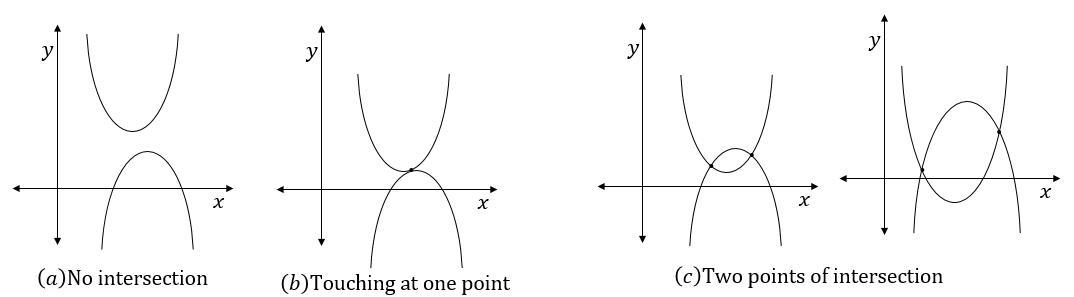
Tiffany is solving an equation where both sides are quadratic expressions. She sets each quadratic equation equal to y and graph
Zina [12379]

Answer:

Step-by-step explanation:

The graph can take on three forms as displayed in the figure.

(a) having no intersections

(b) having a single point of intersection (tangency)

(c) having two points of intersection.

Consequently, the maximum number of intersections that these graphs can yield is 2, as illustrated in figure (c).

3 0
1 month ago
Read 2 more answers
Other questions:
  • A box of 20 Crunchy Munchy cookies costs $2.50 and a box of 40 Crunchy Munchy cookies costs $4.00. One quart of milk costs $1.50
    5·2 answers
  • N example 5.4 and exercise 5.5, we considered the joint density of y1, the proportion of the capacity of the tank that is stocke
    5·1 answer
  • The weights of certain machine components are normally distributed with a mean of 8.01 g and a standard deviation of 0.06 g. Fin
    14·1 answer
  • Solve x2 - 8x - 9 = 0. Rewrite the equation so that it is of the form x2 + bx = c.
    8·2 answers
  • The circumference of a sphere was measured to be 70 cm with a possible error of 0.5 cm. (a) Use differentials to estimate the ma
    5·1 answer
  • The thrill of riding a roller coaster is​ addictive, both for its users who take the​ ride, and for the designers and engineers
    6·1 answer
  • 746.258 as an equivalent expression
    5·2 answers
  • The entire universe of computer games are made up of:
    13·1 answer
  • Find the perimeter of trapezoid WXYZ with vertices W(2, 3), X(4, 6), Y(7, 6), and Z(7,3). Leave your answer in simplest radical
    5·1 answer
  • Zachary is buying 4 tires for his car. The table shows the prices and the advertised sales for the same type of tire at 4 tire s
    7·1 answer
Add answer
Login
Not registered? Fast signup
Signup
Login Signup
Ask question!