Answer:
To gain insights about S' (the derivative of S) from the graph of S:
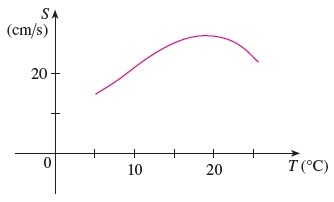
For S'(5), we examine the curve's onset, where S(5) appears to be near 15 cm/s and shows an upward trend subsequently, indicating that S'(5) must be a positive value—meaning the swimming speed increases as temperature rises around T = 5°C.
Conversely, for S'(25), the graph indicates a decline after this temperature, suggesting that S'(25) is negative—implying that increasing the temperature beyond 25°C will lead to reduced speed.
We can estimate these values:
The average change rate in a segment can be expressed as:
S' = (Y2 - Y1)/(X2 - X1)
S is nearly linear between T = 5°C and 10°C where:
S(5) = 15 cm/s and S(10) = 20 cm/s
Thus, the average rate of change in this segment calculates to:
S' = (20 cm/s - 15 cm/s)/(10°C - 5°C) = 1 (cm/s°C)
Consequently, we can reasonably estimate S'(5) to be around 1 (cm/s°C).
A similar approach can be applied for S'(25):
We can assume S(20) = 25 cm/s and S(25) = 20 cm/s.
The average rate of change then becomes:
S' = (20 cm/s - 25 cm/s)/(25°C - 20°C) = -1 (cm/s°C)
Thus, we can predict that S'(25) is close to -1 (cm/s°C).