Function given: c(x) = 0.5x + 70.
Here, c represents the cost in dollars while x indicates the miles driven in the truck.
By comparing this with the slope-intercept format y=mx+b, we find:
Slope m = 0.5, which can be expressed as 1/2.
The y-intercept b = 70.
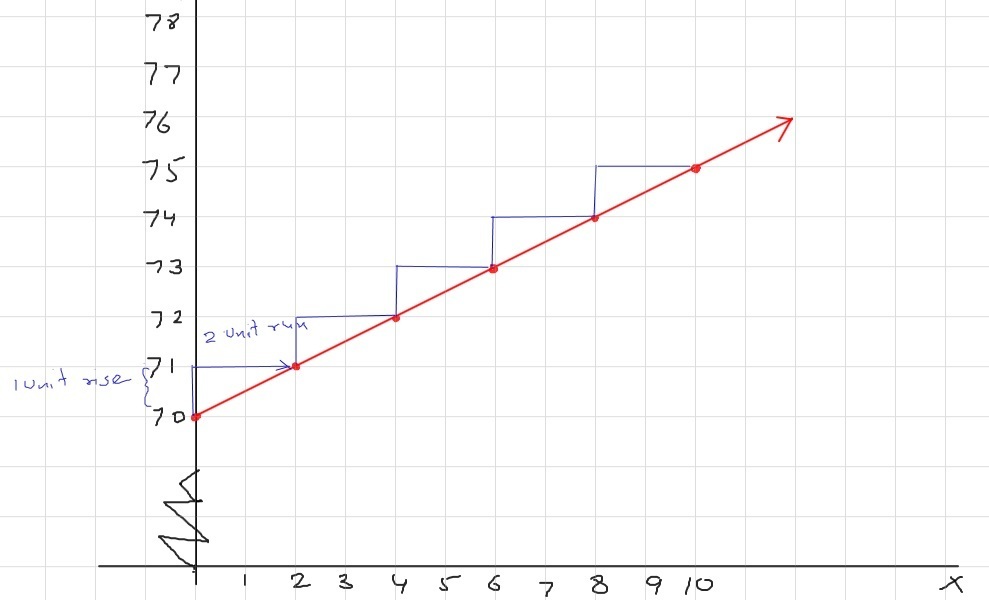
To graph this, we start by plotting the y-intercept at 70 and then add more points based on the rise/run ratio, which is 1/2.
The plotted line shown in red illustrates the function.
It can be observed that the initial cost is $70, corresponding to zero miles driven.
The x values denote the domain while C(x) portrays the range.
We can use x values that are 0 or above, and C values that are 70 or more.
Thus, Domain: x≥0 and Range: C(x)≥70.