To tackle this issue, I recommend creating a chart.
The chart is illustrated below.
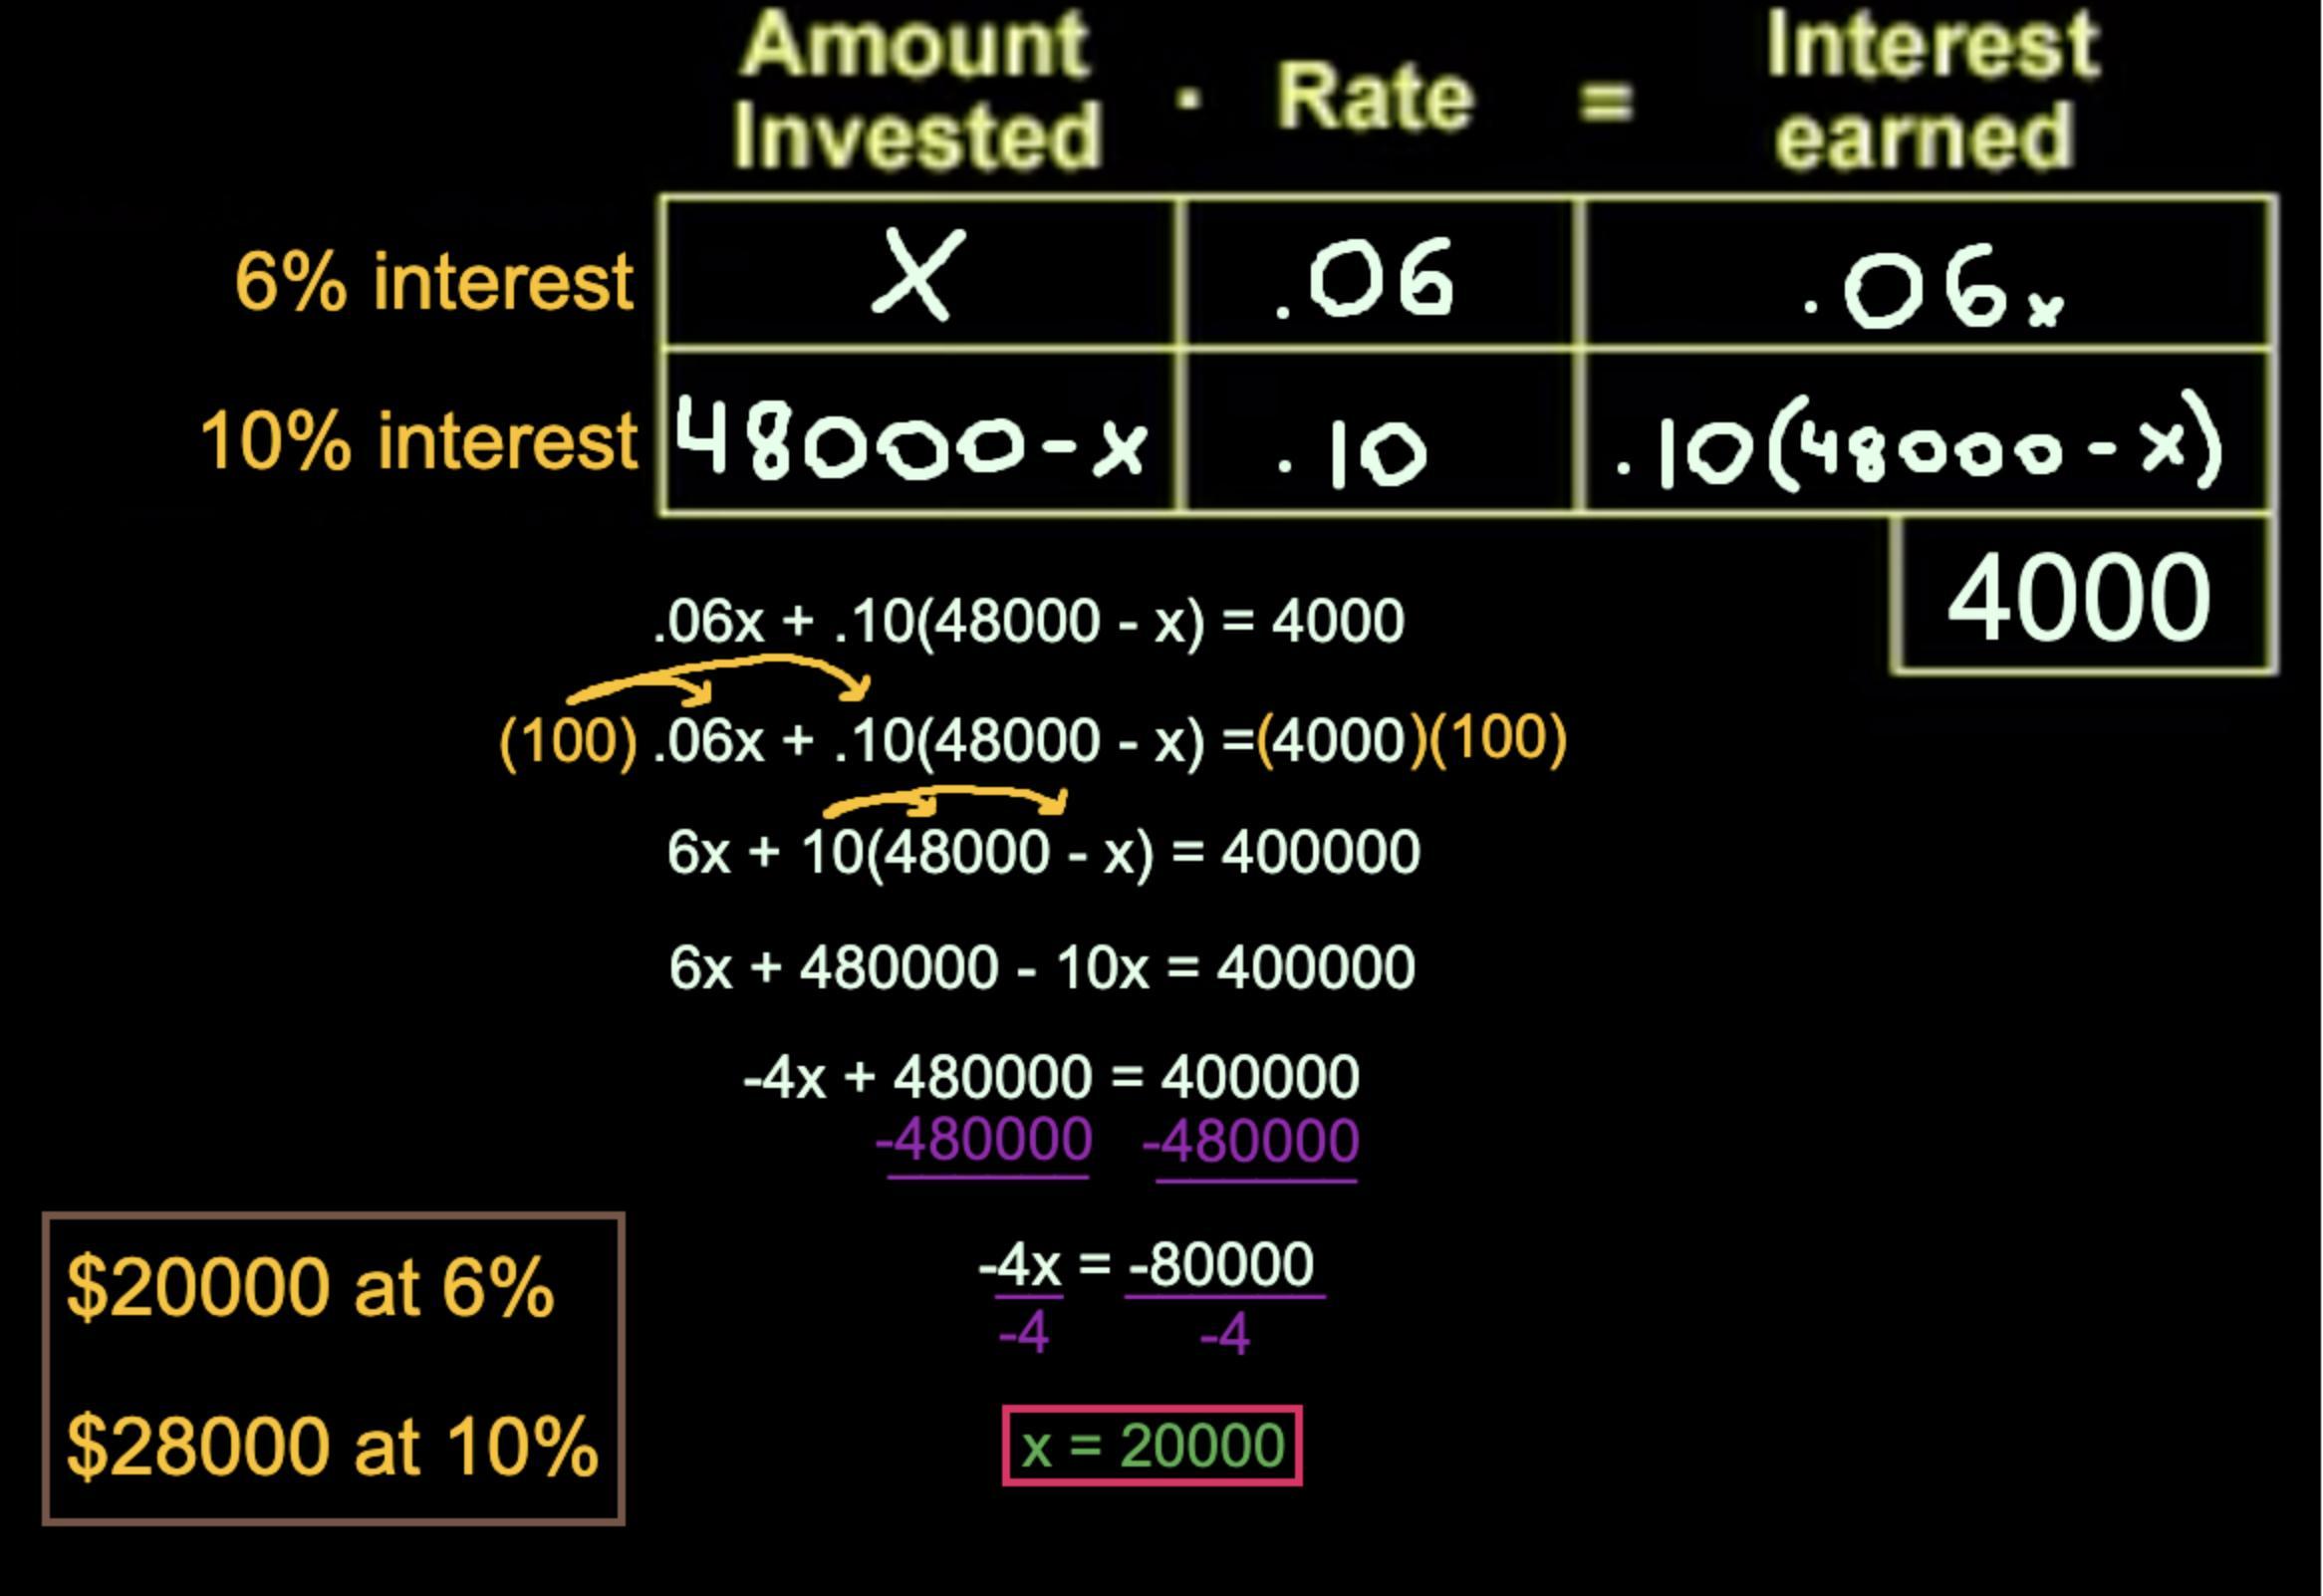
We will base this chart on the interest formula provided below.
Amount Invested · Rate = Interest Accrued
On the left side of the chart, there will be two investment types made by Sam, specifically the 6% and 10% investments.
While we know Sam's total investment is
$48,000, the individual amounts at each interest rate remain unknown.
Thus, we will use x and 48,000 - x to symbolize the respective amounts he invested at the two rates.
The rate column will convert our percentages into decimal form: 6% becomes 0.06 and 10% becomes 0.10.
This translates 6% into 6/100 or 0.06.
Now utilizing our formula, we can compute the products of the first two columns to fill in the third column.
This means we have x times 0.06 equal to 0.06x and also 48,000 - x times 0.10, resulting in 0.10(48000 - x).
Referring to the last segment of the problem, we know Sam generated $4,000 in interest for the year.
By adding the interest amounts he earned from both rates, we equate that to 4000.
The equation can be structured as 0.06x + 0.10(48000 - x) = 4000.
We can eliminate the decimals by multiplying every part of the equation by 100.
This results in 6x + 10(48000 - x) = 400000.
We ultimately determine that x = 20000.
Therefore, Sam invested $20000 at an interest rate of 6%.
The investment amount at 10% is 48000 - x, resulting in 48000 - 20000, or $28,000.