Answer:
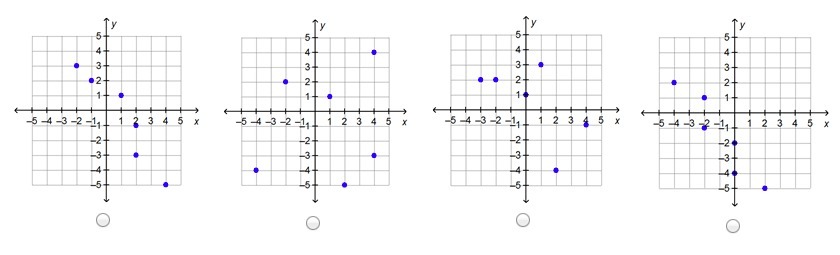
Graph C is the solution.
Step-by-step analysis:
To answer this question, we must recognize that a function is represented by a set of ordered pairs when no x-values correlate with multiple y-values.
For example, with pairs like (1, 2), (1, 3), and (2, 4), the x-values are 1, 1, 2 and the corresponding y-values are 2, 3, and 4.
In this case, for x = 1, we have two y-values (2 and 3), indicating that these do not form a function.
Now, let's evaluate the graphs.
In graph A, at x = 2, we have two y-values (-1 and -3), so it does not represent a function.
In graph B, at x = 4, we find y = 4 and -3, indicating this too is not a function.
In graph C.
For every x-value, there is a unique y-value, qualifying this graph as a function.
As for Graph D,[ [TAG_36]]
For x = -2, there are two y-values: 1 and -1, meaning this graph doesn’t represent a function.