To graph any linear function, only two points are needed. We typically utilize x and y intercepts because they are the simplest to handle.
To calculate the x-intercept, we set y to 0, also known as the function's zero. Let's determine the x-intercepts for these two functions:


Now, we simply assign y=0 and solve for x:


Next, we need to ascertain y-intercepts. To achieve this, we set x to zero.


The graphs of these functions are defined by these two points.


To sketch the graph, simply draw a line connecting these two points.
To find the intersection, we utilize the fact that at the intersection point, both functions have the same value. This can be expressed mathematically as:
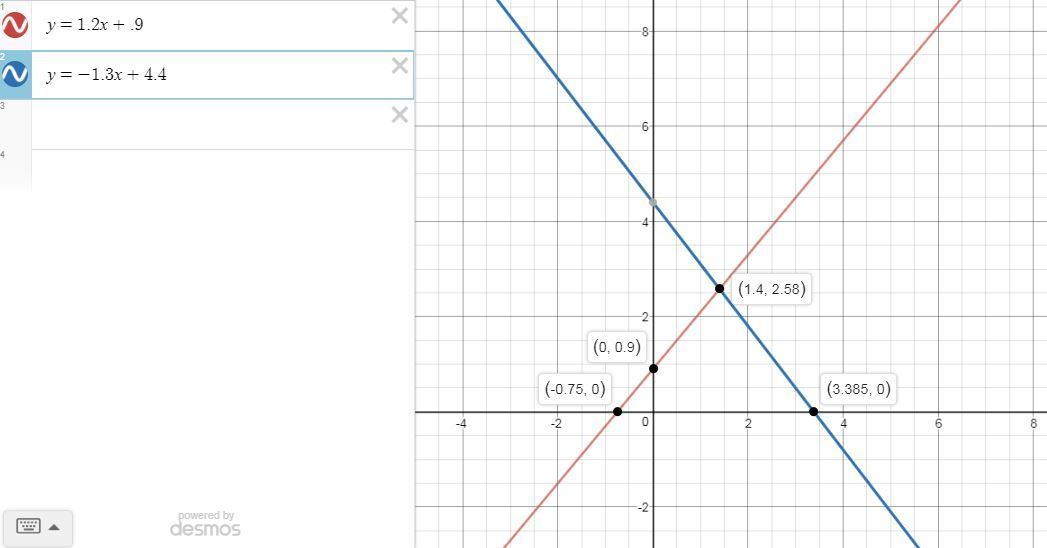
-1.3x+4.4=1.2x+0.9
Now, we solve for x to determine the x-coordinate of the intersection point.


Next, we substitute this x value into any function to find the y-coordinate of the intersection point.


The intersection point's coordinates are (1.4,2.6).
I have provided the graph with all the highlighted points we calculated.