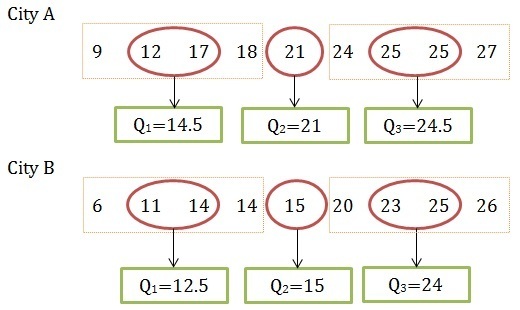
The five-number summary consists of the minimum, maximum, third quartile (Q₃), median (Q₂), and first quartile (Q₁)
. The initial action is to sort each data set in increasing order as demonstrated in the first diagram
. The median (Q₂) for both data sets can be found at the

position.
After identifying the median, we divide the data into two sections: one to the left and one to the right of the median, where Q₁ and Q₃ will be positioned.
Q₁ is found between the

and

values, while Q₃ lies between the

and

values.
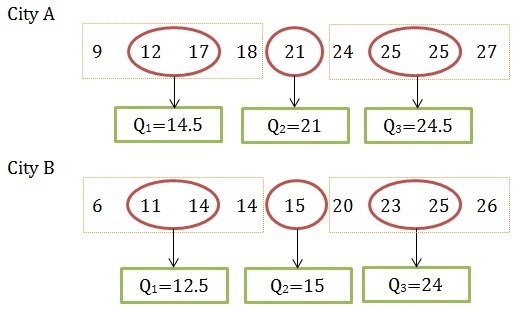
The box plots for both data sets appear in the second diagram
. The box plots exhibit asymmetry. City A's box plot stretches more to the left (indicative of negative skew), and City B's box plot also extends leftward (showing negative skew).