Response:
This is my understanding.
Explanation:
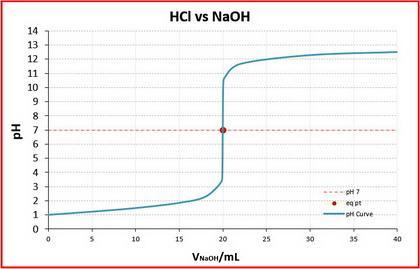
(g) Titration curves
While I can't create two curves on a single graph, I can depict them separately for clarity.
In part (d), the graph indicated an equivalence point at 20 mL.
For the second titration, since the NaOH concentration is doubled, the volume to reach the equivalence point will be halved — 10 mL.
Below are the two titration curves.
(h) Evidence of reaction
Both HCl and NaOH are colorless solutions.
There is no gas released or precipitate formed during their reaction.
It’s likely the student observed that the Erlenmeyer flask heated up, indicating a chemical change.