Answer:
This is what I deduce
Explanation:
I take it you have constructed a calibration curve, which plots the absorbance against the concentrations of known samples.
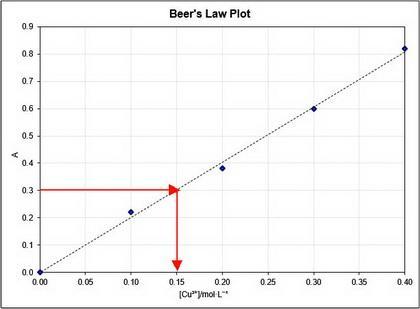
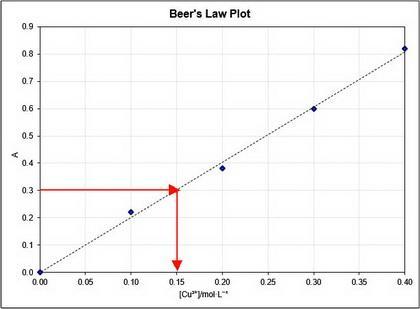
It likely resembled the example shown below.
You then drew the line that best fits the data points, aiming to be as close to all of them as possible without necessarily intersecting any.
Now, you're working with a CuSO₄ solution that displays an absorbance reading of 0.30.
Your first step is to mark 0.30 on the vertical axis and extend a horizontal line to intersect the line of best fit.
Afterward, draw a vertical line down to the horizontal axis to determine the corresponding concentration.
This line will meet the axis at 0.15 mol·L⁻¹.
Thus, you conclude that the concentration of CuSO₄ is 0.15 mol·L⁻¹.